
Introduction
House prices in the region experienced a seasonal slump. Average prices across all housing types in April decreased. Apartment-style condos edged down 3.8% on a year-over-year basis to $245,000 in the first quarter of 2019; townhomes depreciated by 2.2% on a year-over-year basis to $283,500 in the first quarter of 2019; and single-detached house prices dropped by 6.1% on a year-over-year basis to $450,000 in the first quarter of 2019.
Home sales also dwindled by 10.6% in the first quarter of 2019 compared to the same period last year. Single-detached home sales numbered 2,587 units in the first quarter of 2019, slowing 8.5% when compared to the same period in 2018. Townhouse and row-unit sales numbered 506 units in the first quarter of 2019, down by 8% from the same period in 2018. Apartment-unit sales numbered 532 in the first quarter of 2019, declining 15.3% from the same period in 2018.
There were 5.1 months of inventory for single-detached homes at the end of the first quarter of 2019, up from the 4.7 months of stock recorded at the end of the first quarter of 2018. With a more balanced market, single-detached units spent more time on the market in the first quarter of 2019 than they did a year earlier. The homes took a median of 48 days to sell during the first quarter of 2019, up by 18 days compared to the first quarter of 2018.
On the other hand, there was 5.5 months’ worth of townhouse and row-unit inventory during the first quarter of 2019—a 5.08% improvement from the 5.9 months recorded at the end of the first quarter of 2018. Despite a tighter market, townhouse and row units spent more time (53 days) on the market in the first quarter of 2019 than they did in the first quarter of 2018 (50 days). Lastly, with 7.7 months’ worth of listings at the end of 2019’s first quarter (unchanged from the same period in 2018), apartment units have the highest inventory among the mentioned housing units. These apartment units took 53 days to sell as of the first quarter of 2019 compared to only 51 days in the same quarter of 2018.
Overview
An Alberta city, Calgary is still steeped in western culture, earning its nickname “Cowtown” because of its massive July rodeo and festival “Calgary Stampede”. It is surrounded by skyscrapers, thanks to the rapid growth it has experienced as the centre of Canada’s oil industry. Cost of living is relatively higher compared to its neighbouring cities in Alberta but much lower compared to other major cities in Canada. The city had its taste of the most recent economic crisis which makes housing prices and rentals in the city competitive— good news to newcomers in the city.
Demographics
Population
Calgary is a young city, and it’s not getting much older. The median age of Calgarians is a young 36.9 years according to the Annual Demographic Estimates (Statistics Canada, 2019), with 70.2% of the population between the ages of 15 and 64. As the city’s population grows over the next few years, the proportion of toddlers and preschoolers is expected to stay about the same; the number of teenagers will decline slightly; and the number of seniors is set to increase.
Employment
The unemployment rate in Calgary was 7% at the end of May 2019, down 0.6% from the previous month to the lowest level since the end of 2015. The number of full-time jobs was up from the end of the previous month to a new monthly record. There were 8,500 more full-time jobs in May 2019 compared to a month earlier. A loss of 1,800 part-time positions translated to an increase in full-time jobs, which totalled 6,700 in May.
Full-time job gains occurred mainly in manufacturing, transportation and warehousing, the financial sector, education, healthcare, and public administration. These gains offset losses occurring mainly in science and technology, services, business and building services, and information and culture services.
Education
Calgary’s education system features globally competitive programs made available to students of all ages. The city boasts of a high-calibre public school system and seven universities and colleges, in addition to the options for higher and continuing education and training facilities. In 2016, the University of Calgary was ranked number one among North American universities founded in the last 50 years.
The Class Size Initiative rolled out in 2004 to 2005 enhanced the student learning experiences of students in Alberta, especially in Calgary, because of how it reduced the class sizes to only 18 to 25 students per class.
Additionally, under the provincial School Act, resident students with special needs are provided with individualized educational programs designed to maximize their potential. School board staff work collaboratively with parents of gifted pupils who have mild, moderate, or severe disabilities.
Lower-income parents are not left behind as they are offered subsidies from Children’s Services to cover the cost of daycare. Moreover, Children’s Services has the authority to set the standards of child care in Calgary and the rest of the cities in the Alberta province.
Institutions with post-secondary offerings in Calgary offer diverse options for education. Distance learning, travel study, practicum, internships, and apprenticeships complement classroom education, simultaneously supporting the city’s business, professional, technology, arts, sports, and non-profit communities. These programs also cater to international students and those interested in lifelong learning, especially recent graduates of secondary schools.
Finally, tertiary education in Calgary is readily available. The University of Calgary, for one, despite being a relatively young and small institution, is gaining a reputation as an excellent, research-orientated, interdisciplinary academy.
Economic Performance
According to a BCG study, Calgary ranks second in having the most business-friendly environment compared to other North American cities. Over several decades, Calgary developed a leading business environment supported by available commercial and industrial real estate. The city enjoys low corporate tax rates, accessible equity and debt financing for enterprises, stable investment conditions, and zero provincial sales taxes and healthcare premiums. As a result, Calgary’s economy has a history of leading Canada’s overall growth. These factors make the city a cost-effective location for any business—from startups to multinational corporations.
Vacancy Rates
According to the Canada Mortgage and Housing Corporation, the overall vacancy rate in this region decreased by 37.09%—from 6.2% in 2018 to 3.9% in 2018. Rentals alone accounted for 43,392 units, the prices of which average $1,159.
Housing Cycle
Building Permits
Quantity of Building Permits
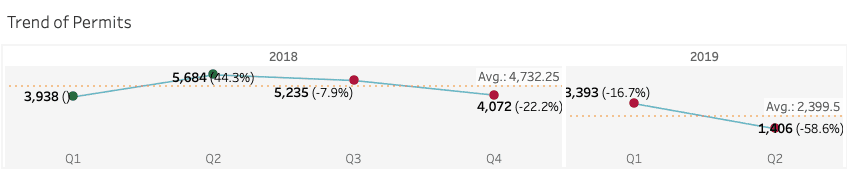
The year 2019 in Canada’s third-largest municipality, Calgary, opened with a total of 3,393 issued building permits—a 16.67% decrease from the previous quarter’s figure. The first quarter was short by 13.84%, with 3,938 building permits issued in the first quarter of last year.
All months exhibited a far less impressive performance this year compared to last year. The onset of 2019 experienced a 5.63% decrease of issuances, with 1,189 issued permits compared to January 2018’s 1,260. However, the building permit issuances in January were 8.68% higher compared to the previous month’s 1,094. The downward trend continued in February, with only 1,003 permits issued—a 17.58% decrease from the 1,217 issuances in February of last year. The months of March and April, luckily, picked up the slack by 19.74% and 17.1% respectively. There were 198 more building permits issued in March, and the month of April added another 205. Despite this increase, March’s total of 1,201 issuances and April’s 1,406 were just 17.80% and 1.82% lower than numbers recorded in the same month of last year.
Value of Building Permits
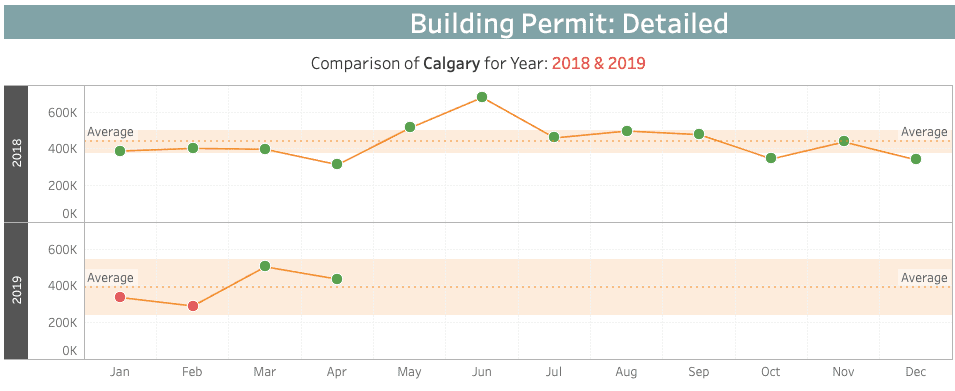
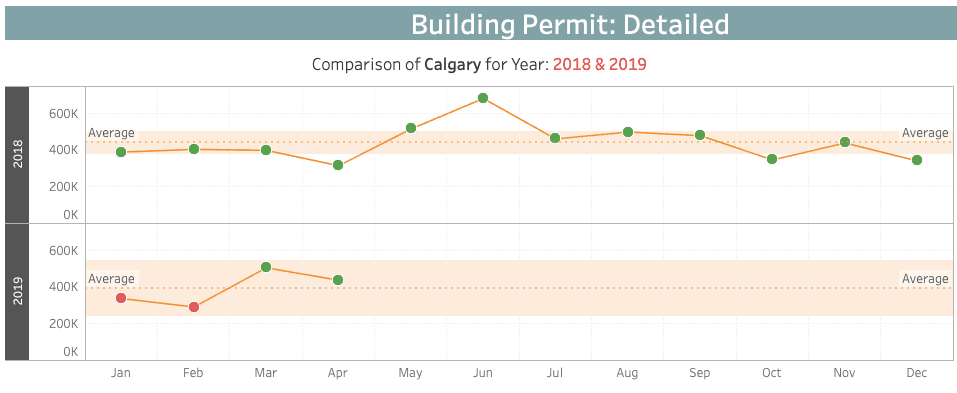
In this year’s first quarter, the building permits issued were valued at $1,130,718—a 0.73% increase from the previous quarter’s $1,122,518 but a 4.86% decrease from the $1,188,422 worth of issuances recorded in the first quarter of 2018. Also, in Q2 of this year, the values of the building permits went down to $436,166—a staggering 61.43% decrease from the previous quarter.
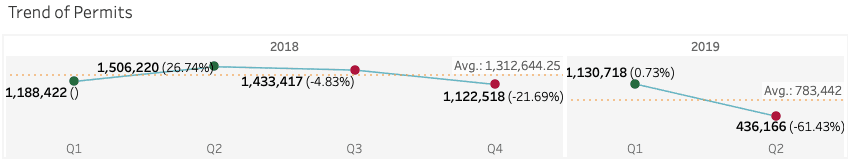
As for the monthly observations, the value of permits issued in January 2019, totalling $336,356, decreased by 13.25% from the same month of last year and is also lower by 0.91% compared to the previous month. The value of permits continued to slide down to 13.67% in February, with only $290,615 worth of building permits. The number of issued building permits recorded in February 2019 is also 27.82% less than that of February 2018. Conversely, the next months’ permits amounted to $503,447, which is 26.59% higher than March of 2018. At $436,166, the value of issued permits in April may be lower than the previous month by 13.36% but is still higher by 39.01% compared to the $313,575 value recorded in the same month of last year.
Housing Starts
Calgary opened 2019 with 700 units in housing starts—a 7.5% increase from January 2018’s 651, and a 32.08% ascent from the previous month’s 530. The biggest chunk (38.43%) of the total housing starts consisted of single-detached houses. Row units came in second with 196 starts, comprising 28%. Only 62 of the housing starts that made up the smallest 8.86% of the total were classified as semi-detached unit types.
In February, apartments and other unit types took over single-detached houses by a fraction, contributing 39.04% of all housing starts. These housing types waned from 235 to 93 units, however, on the next month—a 60.43% decrease. On the contrary, it picked up a lot on April with 545 units in total housing starts, that is, 57.07% of all housing starts on that month. The 254 single-family housing starts in April were only second to apartment-type housing starts but suddenly took over the largest percentage of all housing starts in May, comprising 36.21% of all housing starts or 294 housing units.
Overall, the 1,822 housing starts in the first quarter of 2019’ were 11.55% less than numbers recorded in the same quarter of the previous year. This quantity , however, remained fairly consistent throughout the second quarter, when it totalled 1,767 housing starts—only a 3.02% reduction compared to the previous quarter.
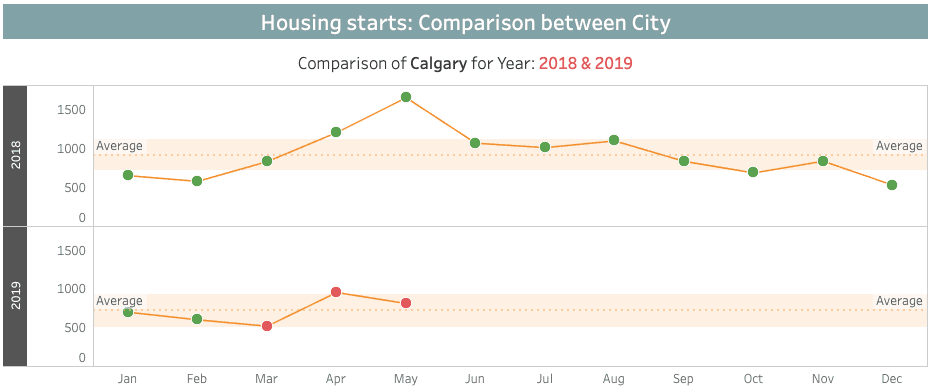
Month on month, housing starts in the first quarter of 2019 declined—by 14% in February and 13.62% in March, with 602 and 520 housing starts, respectively. At 955 units, numbers picked up in April. This was a huge 83.65% improvement against the previous month. May, however, saw numbers decline again, the month seeing a 14.97% decline with 812 units.
Housing Under Construction
Averaging approximately 10,919 units per month, the number of houses that were under construction in Calgary was on a slow downward trend starting in Q3 of 2018. The first quarter this year had 32,826 units under construction—an 8.06% reduction from the previous quarter. Apartments and other unit types led the number of houses under construction, averaging 61% of the total units under construction in the first quarter.
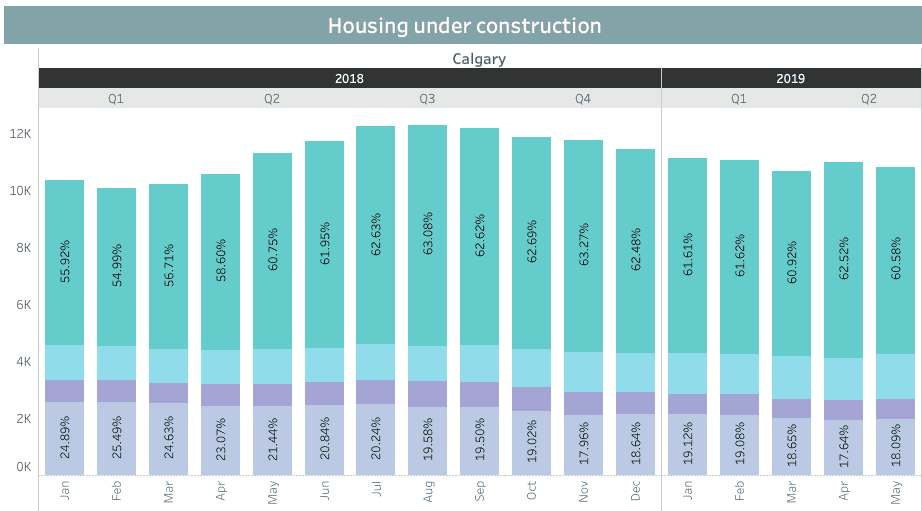
In 2019, the number of constructions in the first three months were all above the previous year’s performance: 7.29% in January, 9.50% in February, and 4.57% in March. Overall, the housing construction in the first quarter of 2019 increased slightly by 7.10% from Q1 of 2018.

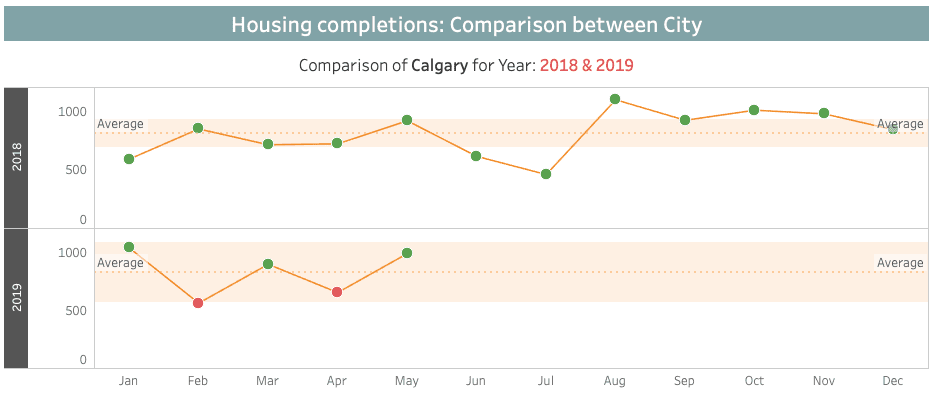
Housing Completions
Housing completions for the first quarter this year, which totalled 2,495, saw an increase of 15.67% from Q1 of last year (which recorded 2,157 completions) but a decline of 11.90% from last quarter’s 2,832 completions. However, in the second quarter, the completions declined by 34.22% to 1,641 completed units. The apartment-type units prevailed over other housing types, contributing 42% of all houses completed during the first quarter and 44.67% in the second. Single-detached came in second with 805 units in the first quarter (32.26%) and 585 units in the next (35.65%).
With 1,037 total completed units, January 2019 had the most completions, followed by the month of May, which recorded 988 completed units.
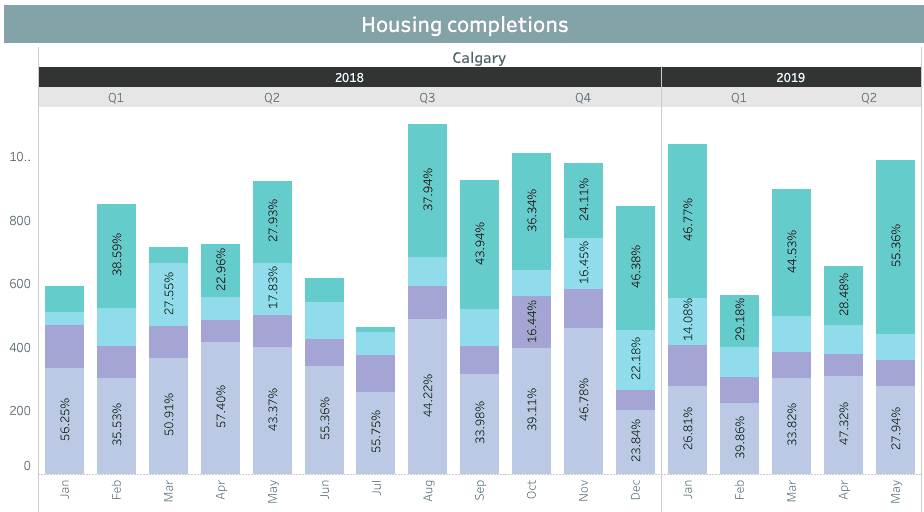
Monthly completions this year fluctuated over time. February 2019 was the most depressed, recording only 562 completions—33.88% lower than February 2018’s performance and 45.81% lower than that of the previous month. Conversely, housing completions in March and May 2019 picked up tremendously by 59.43% and 51.30%, respectively, compared to the same month the year prior.
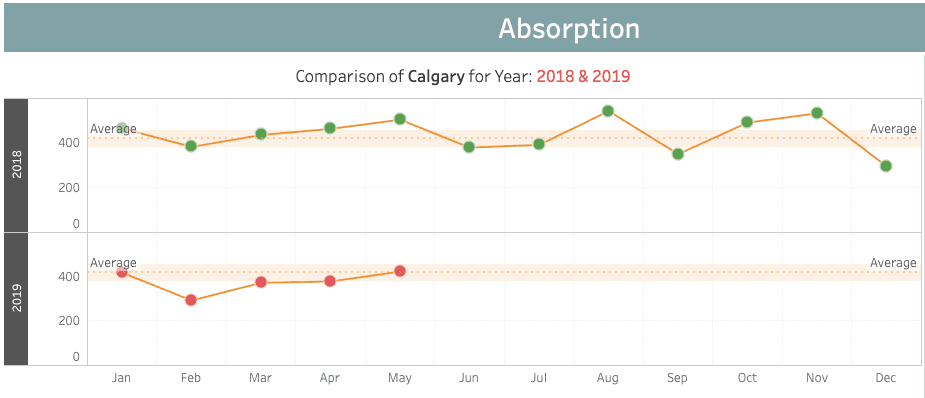
Absorptions
Calgary’s absorptions in Q1 2019 followed the trend of absorptions in the same period last year. With 1,076 total units absorbed compared to 1,275 in Q1 2018, this quarter saw a 15.61% depreciation. The absorptions in the first three months of this year didn’t perform as well as the same period last year. The 415 absorbed units in January were a 10.17% underperformance against the 462 absorptions recorded in the same month of the previous year. The next month saw a 29.87% decrease from January, but in March, it grew to 370 absorbed units—an increase of 27.15%. Absorptions in all months of the second quarter of this year were down by 26.02% compared to the previous quarter, but an upward trend was observed in this period as well, with April experiencing 376 unit completions (1.62% appreciation from the previous month) and May seeing 420, 11.70% higher compared to April. Despite this increase, these second quarter numbers still did not meet the previous year’s absorption numbers, which are 17% higher on average compared to the second quarter of this year.
Summary
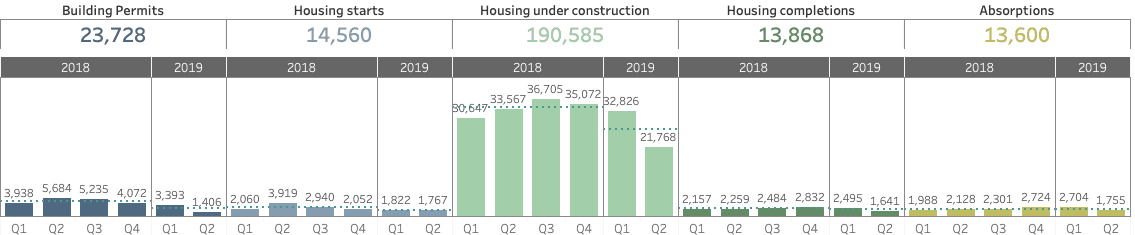
The permit issuances started to lessen in the 3rd quarter of 2018 and have continued through 2019. With only 1,406 building permits issued in Q2 2019 as opposed to the previous quarter’s 3,393 and Q2 2018’s 5,684, issuances were at an all-time low this quarter compared to all quarters of last year. This downtrend is also seen in all other parts of the housing cycle. With only 1,767 units, housing starts were also at their all-time low this latest quarter. During this period, only 1,641 residential properties were completed out of the 21,768 houses that were still under construction, and 1,755 were absorbed. These drops accounted for 17.53% to over 75% of decreases in quantity compared to the same quarter of the previous year.
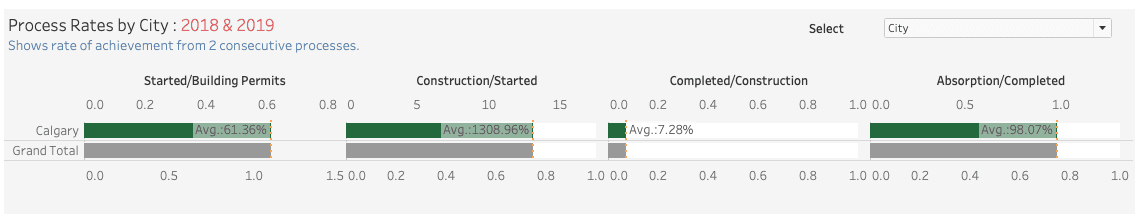
We can see that in the second quarter of 2019, there were more housing starts (25.68%) than the number of issued building permits. Housing constructions surpassed housing starts 11 times (a whopping 1,131.92%), and yet, compared to these constructions, the completed units only accounted for 7.5% this quarter. Surprisingly, there were more asborptions than completions, not just in the current second quarter (106.9%) but also in the previous one (108.38%)
Analysis
The first and second quarter of 2019 saw a steady decrease of building permit issuances, a phenomenon that started in the 3rd quarter of 2018. In Q2 of 2019, the number of permits plummeted by 75.28% to only 1,406 permits compared to Q2 2018’s 5,684. This decline can also be seen in housing starts, with the recent quarter having 25.68% more housing starts than the said quarter’s approved building permits.
The number of housing units under construction also followed the pattern and saw its greatest drop this quarter with only 21,768, which is 40.69% lower than the third quarter of the previous year’s 36,705, the highest-recorded number of constructions since the start of 2018.
Completed houses also seem to have dwindled since the last quarter of 2018. This quarter recorded the lowest numbers with only 1,641 completions—a 42.06% decrease from the highest-recorded quarter, which recorded 2,832 completions. Absorptions also followed the trend, totalling only 1,755 completions this quarter, which is a 35.57% decrease from 4th quarter of 2018’s 2,724 absorptions, the highest number since 2018.
Last January 2019, it was predicted that Calgary would likely be a buyer’s market this year due to a weak job market, slow growth, lack of confidence, high inventory and high-interest rates. This may explain why there seems to be a downtrend in all aspects of the housing cycle. However, it is interesting to note that absorptions in the Calgary market in the first two quarters of 2019 are far more than housing completions surpassing the 100% saturation mark. This means that there were far more records of houses being sold on this period compared to the houses that were completed. This is possible since there was still a sufficient amount of inventory before these completions. It may seem like a buyer’s market but this oversaturation may be an indicator that the demand for housing units is starting to pick up. And although the benchmark of home prices in Calgary was reported to have fallen by 1.52% from 2017 and 2018, the increasing demand and the constantly decreasing number of completed homes will eventually pull up the prices of homes in the area. It may be a good choice to think about purchasing a home this period as the prices are still low due to oversupply from 2018. But with these signs of improvement—namely, the over 100% absorption-to-completion rate and the decline in supply—purchases may prove to be good investments as vacancy rates dip and home prices and rentals rise.